2. Estimate Number of Flights
2.1. Introduction
Sq1090 project decodes ADS-B messages into aircraft position data. Use the data to estimate the number of flights during specific period of time and over a defined geographical area.
In this tutorial you will
create SQL query to identify and count flights during COVID-19 pandemic over Dublin airspace
visualise the data with ggplot2 R library
The outcome of the tutorial is presented on the Figure 2.1.1.
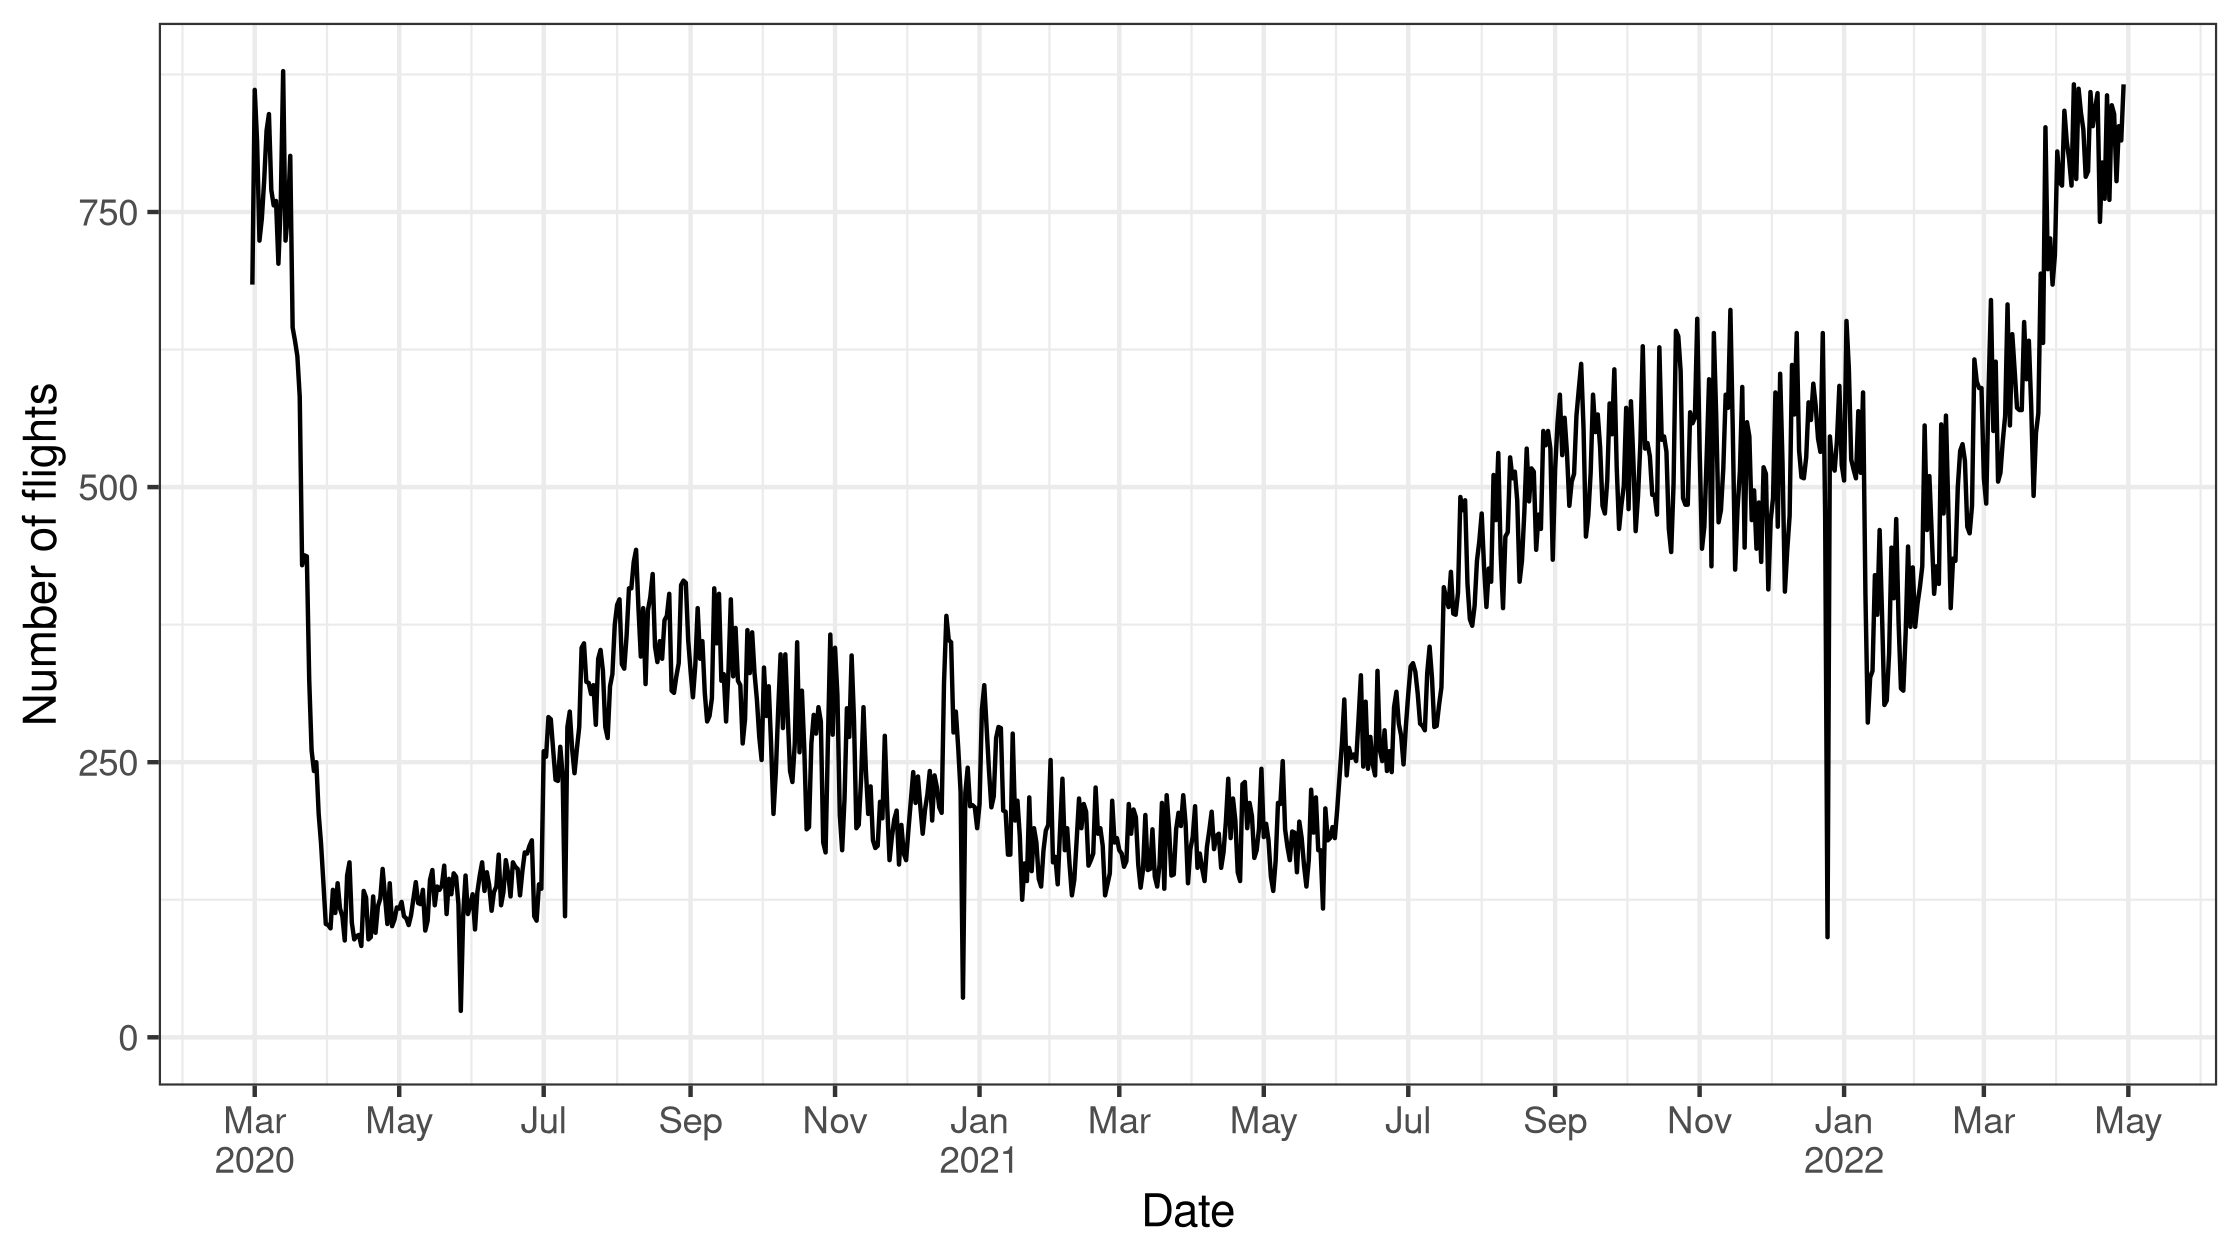
Figure 2.1.1 Number of flights during the COVID-19 pandemic over Dublin airspace.
2.2. Assumptions
On technical level, the tutorial requires familiarity with
Structured Query Language (SQL), Common Table Expressions (CTEs), and window functions within PostgreSQL relational database system.
R programming language for statistical analysis and ggplot2 library.
For the purpose of aircraft position data analysis, let’s define
The Dublin airspace is the circle within 50 km radius of the Dublin Airport.
When an aircraft leaves the airspace and returns after 30 minutes, then the return is counted as an another flight.
COVID-19 time period is
from 2020-02-29 - first case of the virus in Republic of Ireland
to 2022-04-29 - daily reporting of new cases ended
See also COVID-19 in Ireland: Timeline 2020-2023.
2.3. Identify and Count Flights
Sq1090 project decodes ADS-B messages into aircraft positions and stores the
data in the position database table. The table has time, aircraft ICAO
address, and aircraft location columns (see Section 3 for
details)
The table has time, aircraft ICAO address, and aircraft location columns
timeTime of receiving a raw message with aircraft location and altitude.
icaoICAO address of an aircraft. It is an integer number displayed as a hexadecimal number.
locationLocation and altitude of an aircraft. The positions are stored using WGS 84 coordinate system.
Query the position table to establish flight timeline of each aircraft
during the pandemic and over Dublin airpsace
 1select
 2    to_hex(icao) as icao,
 3    lag(time) over (partition by icao order by time) as prev_time,
 4    time
 5from position p
 6where p.time between '2020-02-29Z' and '2022-04-30Z'
 7      and st_dwithin(location,
 8                     st_setsrid(st_makepoint(-6.27, 53.421389), 4326),
 9                     5e4,
10                     true)
11order by icao, time
The query
[6]filters the data leveraging TimescaleDB time index to optimise bucketing and finding aircraft positions based on the specified time interval[7-10]filters the positions over the geographical area using a PostGIS spatial index to optimise execution of the predicate function[3]combines data of each aircraft, orders it by time, and finally, for each time of an aircraft position, identifies time of previous position
The query can return data like
 1 icao   |           prev_time           |             time
 2--------+-------------------------------+-------------------------------
 3 1003e  |                               | 2021-04-13 05:13:10.747583+01
 4 1003e  | 2021-04-13 05:13:10.747583+01 | 2021-04-13 05:13:12.33053+01
 5 1003e  | 2021-04-13 05:13:12.33053+01  | 2021-04-13 05:13:12.92841+01
 6...
 7 1003e  | 2021-04-13 05:13:19.318988+01 | 2021-04-13 05:13:19.706155+01
 8 100a2  |                               | 2021-06-26 05:39:39.91335+01
 9 100a2  | 2021-06-26 05:39:39.91335+01  | 2021-06-26 05:39:53.672599+01
10 100a2  | 2021-06-26 05:39:53.672599+01 | 2021-06-26 05:39:54.764552+01
11...
12 100a2  | 2021-06-26 05:43:15.742002+01 | 2021-06-26 05:43:16.889032+01
13 100a3  |                               | 2020-07-29 11:38:03.443719+01
14 100a3  | 2020-07-29 11:38:03.443719+01 | 2020-07-29 11:38:04.043477+01
15 100a3  | 2020-07-29 11:38:04.043477+01 | 2020-07-29 11:38:04.427198+01
16...
17 100a3  | 2020-07-29 11:39:00.622831+01 | 2020-07-29 11:39:01.059635+01
18 100a3  | 2020-07-29 11:39:01.059635+01 | 2020-07-30 05:01:09.011887+01
19 100a3  | 2020-07-30 05:01:09.011887+01 | 2020-07-30 05:01:10.10184+01
20...
21 100a3  | 2020-07-30 05:06:24.186686+01 | 2020-07-30 05:06:25.280184+01
22 100a3  | 2020-07-30 05:06:25.280184+01 | 2020-08-05 12:51:07.580152+01
23 100a3  | 2020-08-05 12:51:07.580152+01 | 2020-08-05 12:51:13.31518+01
24...
25 100a3  | 2020-08-05 12:54:38.547477+01 | 2020-08-05 12:54:39.58337+01
26...
The output of the query displays flight timeline for three aircrafts. Aircrafts 1003e and 100a2 have one flight each (lines 3-7 and 8-12 respectively). Aircraft 100a3 has three flights (lines 13-17, 18-21, and 22-25). New flight can be identified when the aircraft left Dublin airspace and returned after 30 minutes or more.
Having flight timeline, identify each flight of an aircraft
1select
2    distinct on (day, icao, icao_flight_seq)
3    icao,
4    cast(time_bucket('1 day', time) as date) as day,
5    count(nullif(time - prev_time < '30min'::interval, true))
6        over (partition by icao order by time) as icao_flight_seq
7from flight_timeline
8order by icao, day
The query
[5-6]assigns sequence for each flight of an aircraft[2]reduces an aircraft flight timeline into individual flights
The query, based on the previous sample, returns
1  icao  |    day     | icao_flight_seq
2--------+------------+-----------------
3 1003e  | 2021-04-13 |               0
4 100a2  | 2021-06-26 |               0
5 100a3  | 2020-07-29 |               0
6 100a3  | 2020-07-30 |               1
7 100a3  | 2020-08-05 |               2
8...
Finally, put the two queries together, and count number of flights for each day
 1with flight_timeline as (
 2    select
 3        to_hex(icao) as icao,
 4        lag(time) over (partition by icao order by time) as prev_time,
 5        time
 6    from position p
 7    where p.time between '2020-02-29Z' and '2022-04-30Z'
 8          and st_dwithin(location,
 9                         st_setsrid(st_makepoint(-6.27, 53.421389), 4326),
10                         5e4,
11                         true)
12),
13flight as (
14    select
15        distinct on (day, icao, icao_flight_seq)
16        icao,
17        cast(time_bucket('1 day', time) as date) as day,
18        count(nullif(time - prev_time < '30min'::interval, true))
19            over (partition by icao order by time) as icao_flight_seq
20    from flight_timeline
21)
22select day, count(*) as count
23from flight
24group by day
The final query returns number of flights for a date
1    day     | count
2------------+-------
3 2020-02-29 |   684
4 2020-03-01 |   861
5 2020-03-02 |   814
6 2020-03-03 |   724
7 2020-03-04 |   744
8...
2.4. Read and Visualise Data
Sq1090 database can be queried with SQL by many applications and programming languages. This tutorial uses R programming language to read and visualise the data.
In R, use RPostgreSQL library to execute queries against Sq1090 database.
There are many options to visualise the data in R. ggplot2 library is a popular choice. Additionally, use scales library to control apperance of time axis, and urltools library to pass database system parameters.
Install the libraries in R language environment, for example using its
shell and install.packages function
$ R
> install.packages(c('RPostgreSQL', 'ggplot2', 'scales', 'urltools'))
In R IDE or a text editor, create file with name covid-19-flights.
We will populate the R script with commands to read aircraft flight summary
from database, visualise it on a graph, and save it into a PDF file.
Import the libraries
1library(RPostgreSQL)
2library(ggplot2)
3library(scales)
4library(urltools)
Parse database connection arguments
1args = commandArgs(trailingOnly=T)
2db = url_parse(args[1])
3output = args[2]
Connect to Sq1090 database and execute SQL query (QUERY variable is the
query defined in previous section)
1pg_drv = dbDriver('PostgreSQL')
2conn = dbConnect(pg_drv, dbname=db$path, host=db$domain, port=db$port)
3data = dbGetQuery(conn, QUERY)
Plot the number of flights during the pandemic over Dublin airspace (see Figure 2.1.1 in the introduction)
1p = (ggplot(data, aes(day, count))
2     + geom_line()
3     + scale_x_date(date_breaks='2 months', labels=label_date_short())
4     + labs(x='Date', y='Number of flights')
5     + expand_limits(y=0)
6     + theme_bw())
7
8ggsave(output, plot=p, width=2240, height=1260, units='px')
Execute the script to create the plot in PDF format
Rscript covid-19-flights postgresql://localhost:5432/sq1090 covid-19-flights.pdf
2.5. Conclusions
Sq1090 decodes ADS-B messages into aircraft position data.
The position data is stored in Sq1090 database position table. Query
the table to identify and count flights during a specific period of time
and over a defined geographical area.
In this tutorial, we implemented R script to plot number of flights during COVID-19 pandemic over Dublin airspace.
The source code of the script can be found in Sq1090 project repository
You can study Sq1090 project data model by reading its reference documentation, Section 3.